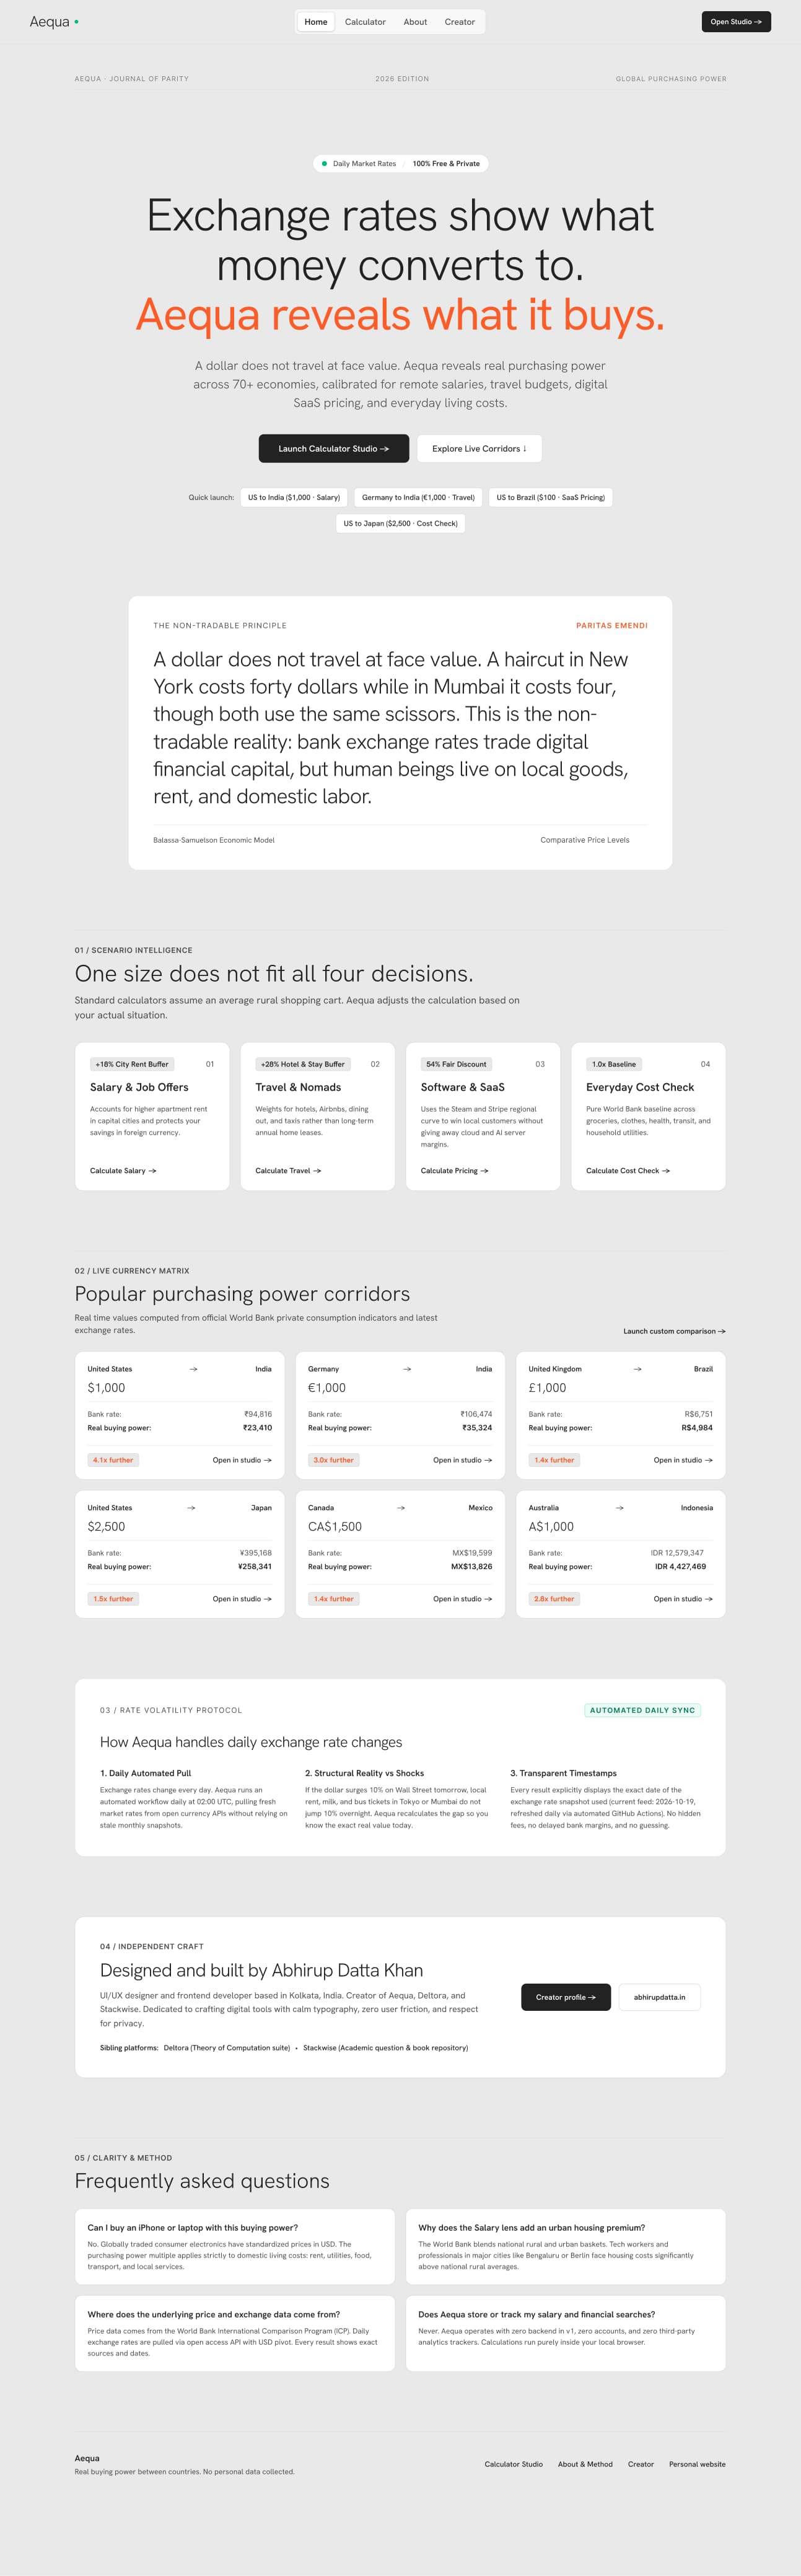
The
product
Aequa is a free, browser-based purchasing power tool that tells you what an amount of money in one country is actually worth in another, in real buying power, not just exchange rate. It covers 70+ economies, runs on World Bank International Comparison Program (ICP) data plus daily market exchange rates, and adjusts the result for the decision you are making: a salary offer, a trip, a software price, or everyday living costs. The core premise: bank exchange rates trade digital financial capital, but human beings live on local goods, rent, and domestic labor. There are no accounts, no backend in v1, and no analytics trackers - everything runs inside the user's browser.
What I was after
Teach the concept before asking for input - explain the non-tradable principle with the haircut example and popular corridors before demanding user interaction, earning trust through transparency
One question, four lenses - replace a simplistic single multiplier with decision-specific models: a +18% city living buffer for salaries, a +28% hotel buffer for travel, a 54% regional SaaS discount, and a 1.0x baseline for everyday living
Editorial framing over dashboard clutter - present the interface as a publication (Journal of Parity) with calm typography, Latin section headers, and transparent data timestamps rather than chaotic tickers
Choices that shaped it
One question, four lenses
A single multiplier would be simpler and wrong. Aequa adjusts the calculation to the user's situation: a +18% city rent buffer for salaries and job offers, a +28% hotel and stay buffer for travel, a 54% fair discount for software and SaaS pricing, and a 1.0x pure World Bank baseline for everyday costs. Choosing the lens is the first decision the user makes, framed as 'one size does not fit all four decisions.'
Teach the idea before asking for input
Before the tool asks anything of the user, the page explains the non-tradable principle in plain terms, anchored on the haircut example. The Balassa-Samuelson model and comparative price levels are named for people who want the theory, but nobody needs them to understand the point. The product earns trust by explaining itself first.
Show the gap side by side
Every result puts two numbers side by side: what you get at the exchange rate, and what the same lifestyle costs locally. For $1,000 from the United States to India, that is Rs. 1,94,816 against Rs. 1,23,410, which the tool states plainly as 'your money goes 4.1x further there.' The popular corridors section repeats the pattern so the concept lands before the user types anything.
Focused Calculator Studio
Choosing a lens opens a dedicated workspace built around one flow: pick a preset or a lens (Salary, Travel, Pricing, Cost check), set an amount, choose the two countries, read the result. The amount label rewrites itself per lens ('Offer in...', 'Budget in...', 'Price in...', 'Amount in...') so the user always knows what question they are answering.
Lens Intelligence panel
Below each answer, a panel names the lens, shows its adjustment as a badge (for example '+18% city living buffer'), and breaks the logic into what is inside the number, where it comes from, and what local labor does to prices. The user can check the reasoning without leaving the page, with a clear note that global electronics cost the same everywhere.
Privacy by architecture
'100% Free & Private' sits in the header. In v1 there is no backend, no accounts, and no third-party trackers, and calculations run entirely in the local browser. For a tool where people type in their salary and budget, that is an intentional design decision as much as a technical one.
What's inside
Editorial header, live FX & ICP feed badges, the non-tradable principle explainer, the four scenario selector cards, six popular purchasing power corridors, methodology breakdown, and creator banner.
Interactive conversion workspace with quick-launch preset amounts ($100 to $10,000), source/target country pickers with flags, swap control, and real-time comparative purchasing power results.
Contextual explanation below every calculation detailing the formula, urban housing premium, tradable vs. non-tradable goods ratio, and data provenance.
Transparent documentation explaining the World Bank ICP methodology, daily FX snapshot cadence via GitHub Actions, limitations on consumer electronics, and privacy architecture.
Designer note explaining why Aequa was built, the philosophy of calm technical software, and cross-links to sibling tools Deltora and Stackwise.
Built with care
Built as a lightweight, zero-latency browser application using modern Next.js and client-side reactive state. To avoid server costs and protect user privacy, the entire 70+ economy World Bank ICP dataset is bundled into an optimized static JSON matrix, while market exchange rates are refreshed daily at 02:00 UTC via an automated GitHub Actions pipeline. Calculations, currency formatting, and regional adjustments happen instantaneously in memory with zero network latency and zero tracking cookies.
What I'd push further
Aequa is the project where I tried to make something technical feel calm: a concept from economics, built into a tool anyone can use in a few seconds. It ships with an automated daily data refresh, four scenario-specific calculation models, and a method page that explains its sources and limits in the open. What I would push further: adding historical trend tracking to visualize how domestic inflation and currency shifts have compressed or expanded purchasing power gaps over the last decade.